Platform Overview
Complete AI Observability Suite
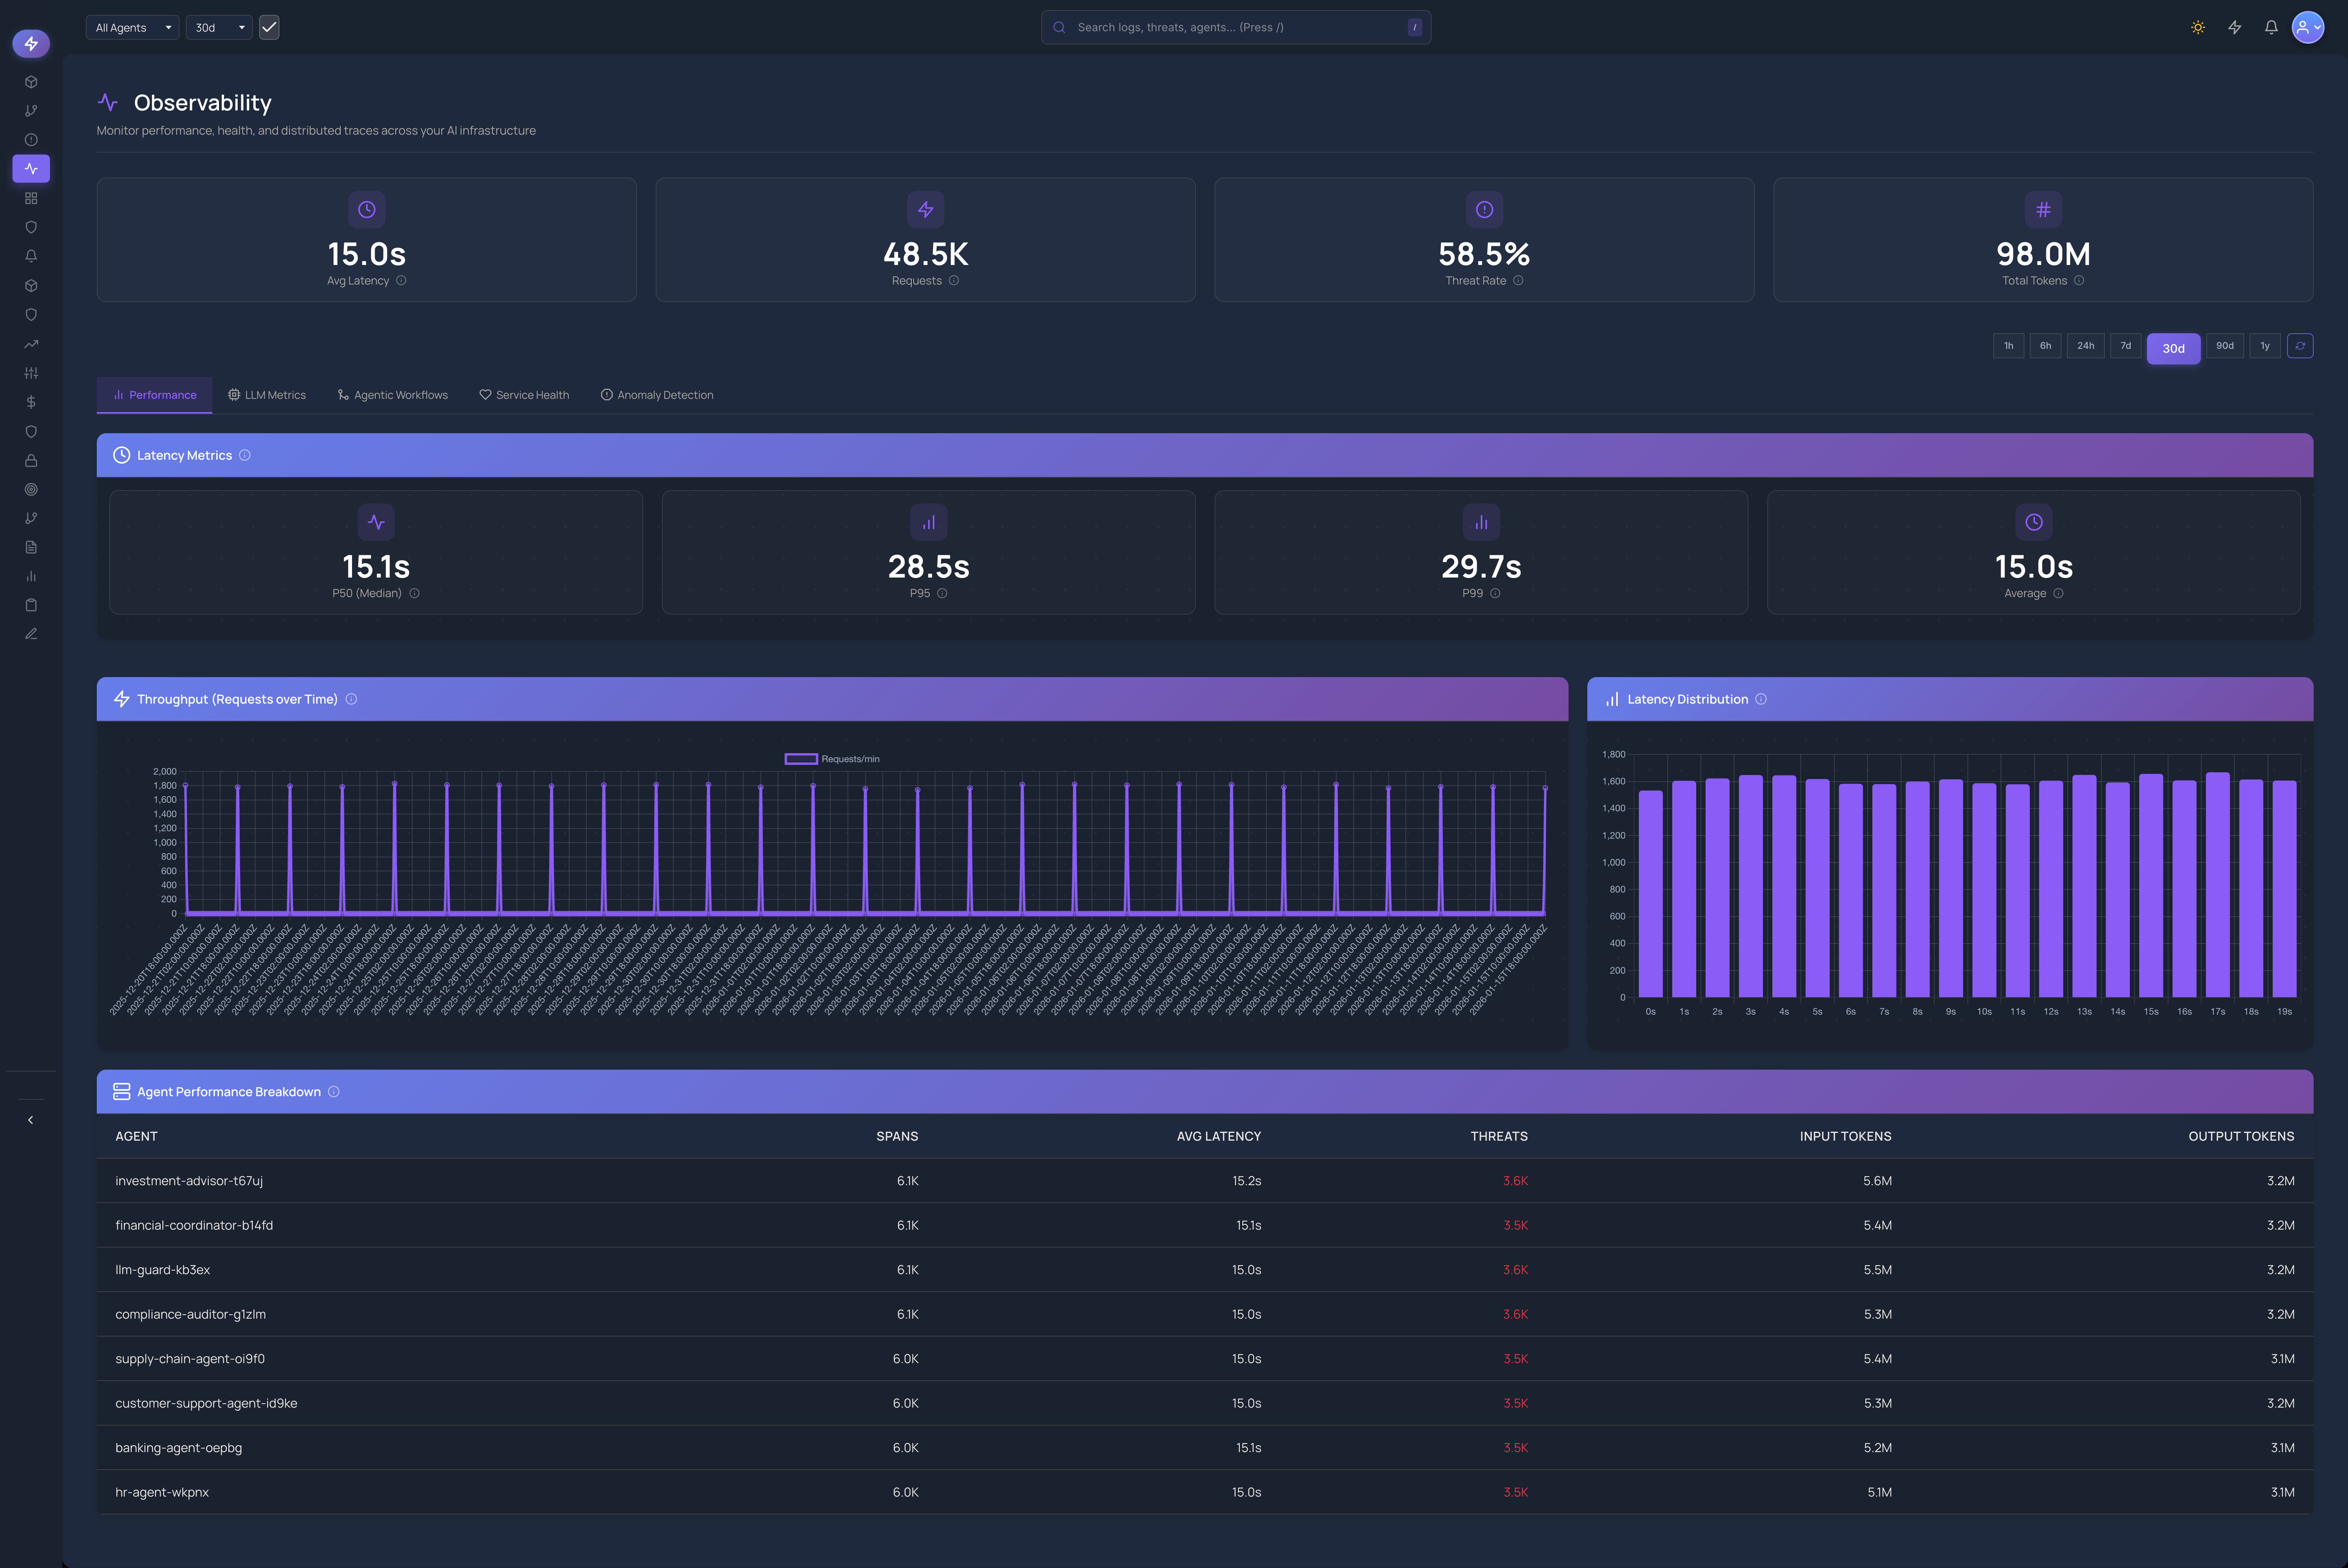
Performance Metrics
Track latency, throughput, and resource utilization across all your AI agents.
- P50/P95/P99 latency tracking
- Request throughput analysis
- Resource utilization metrics
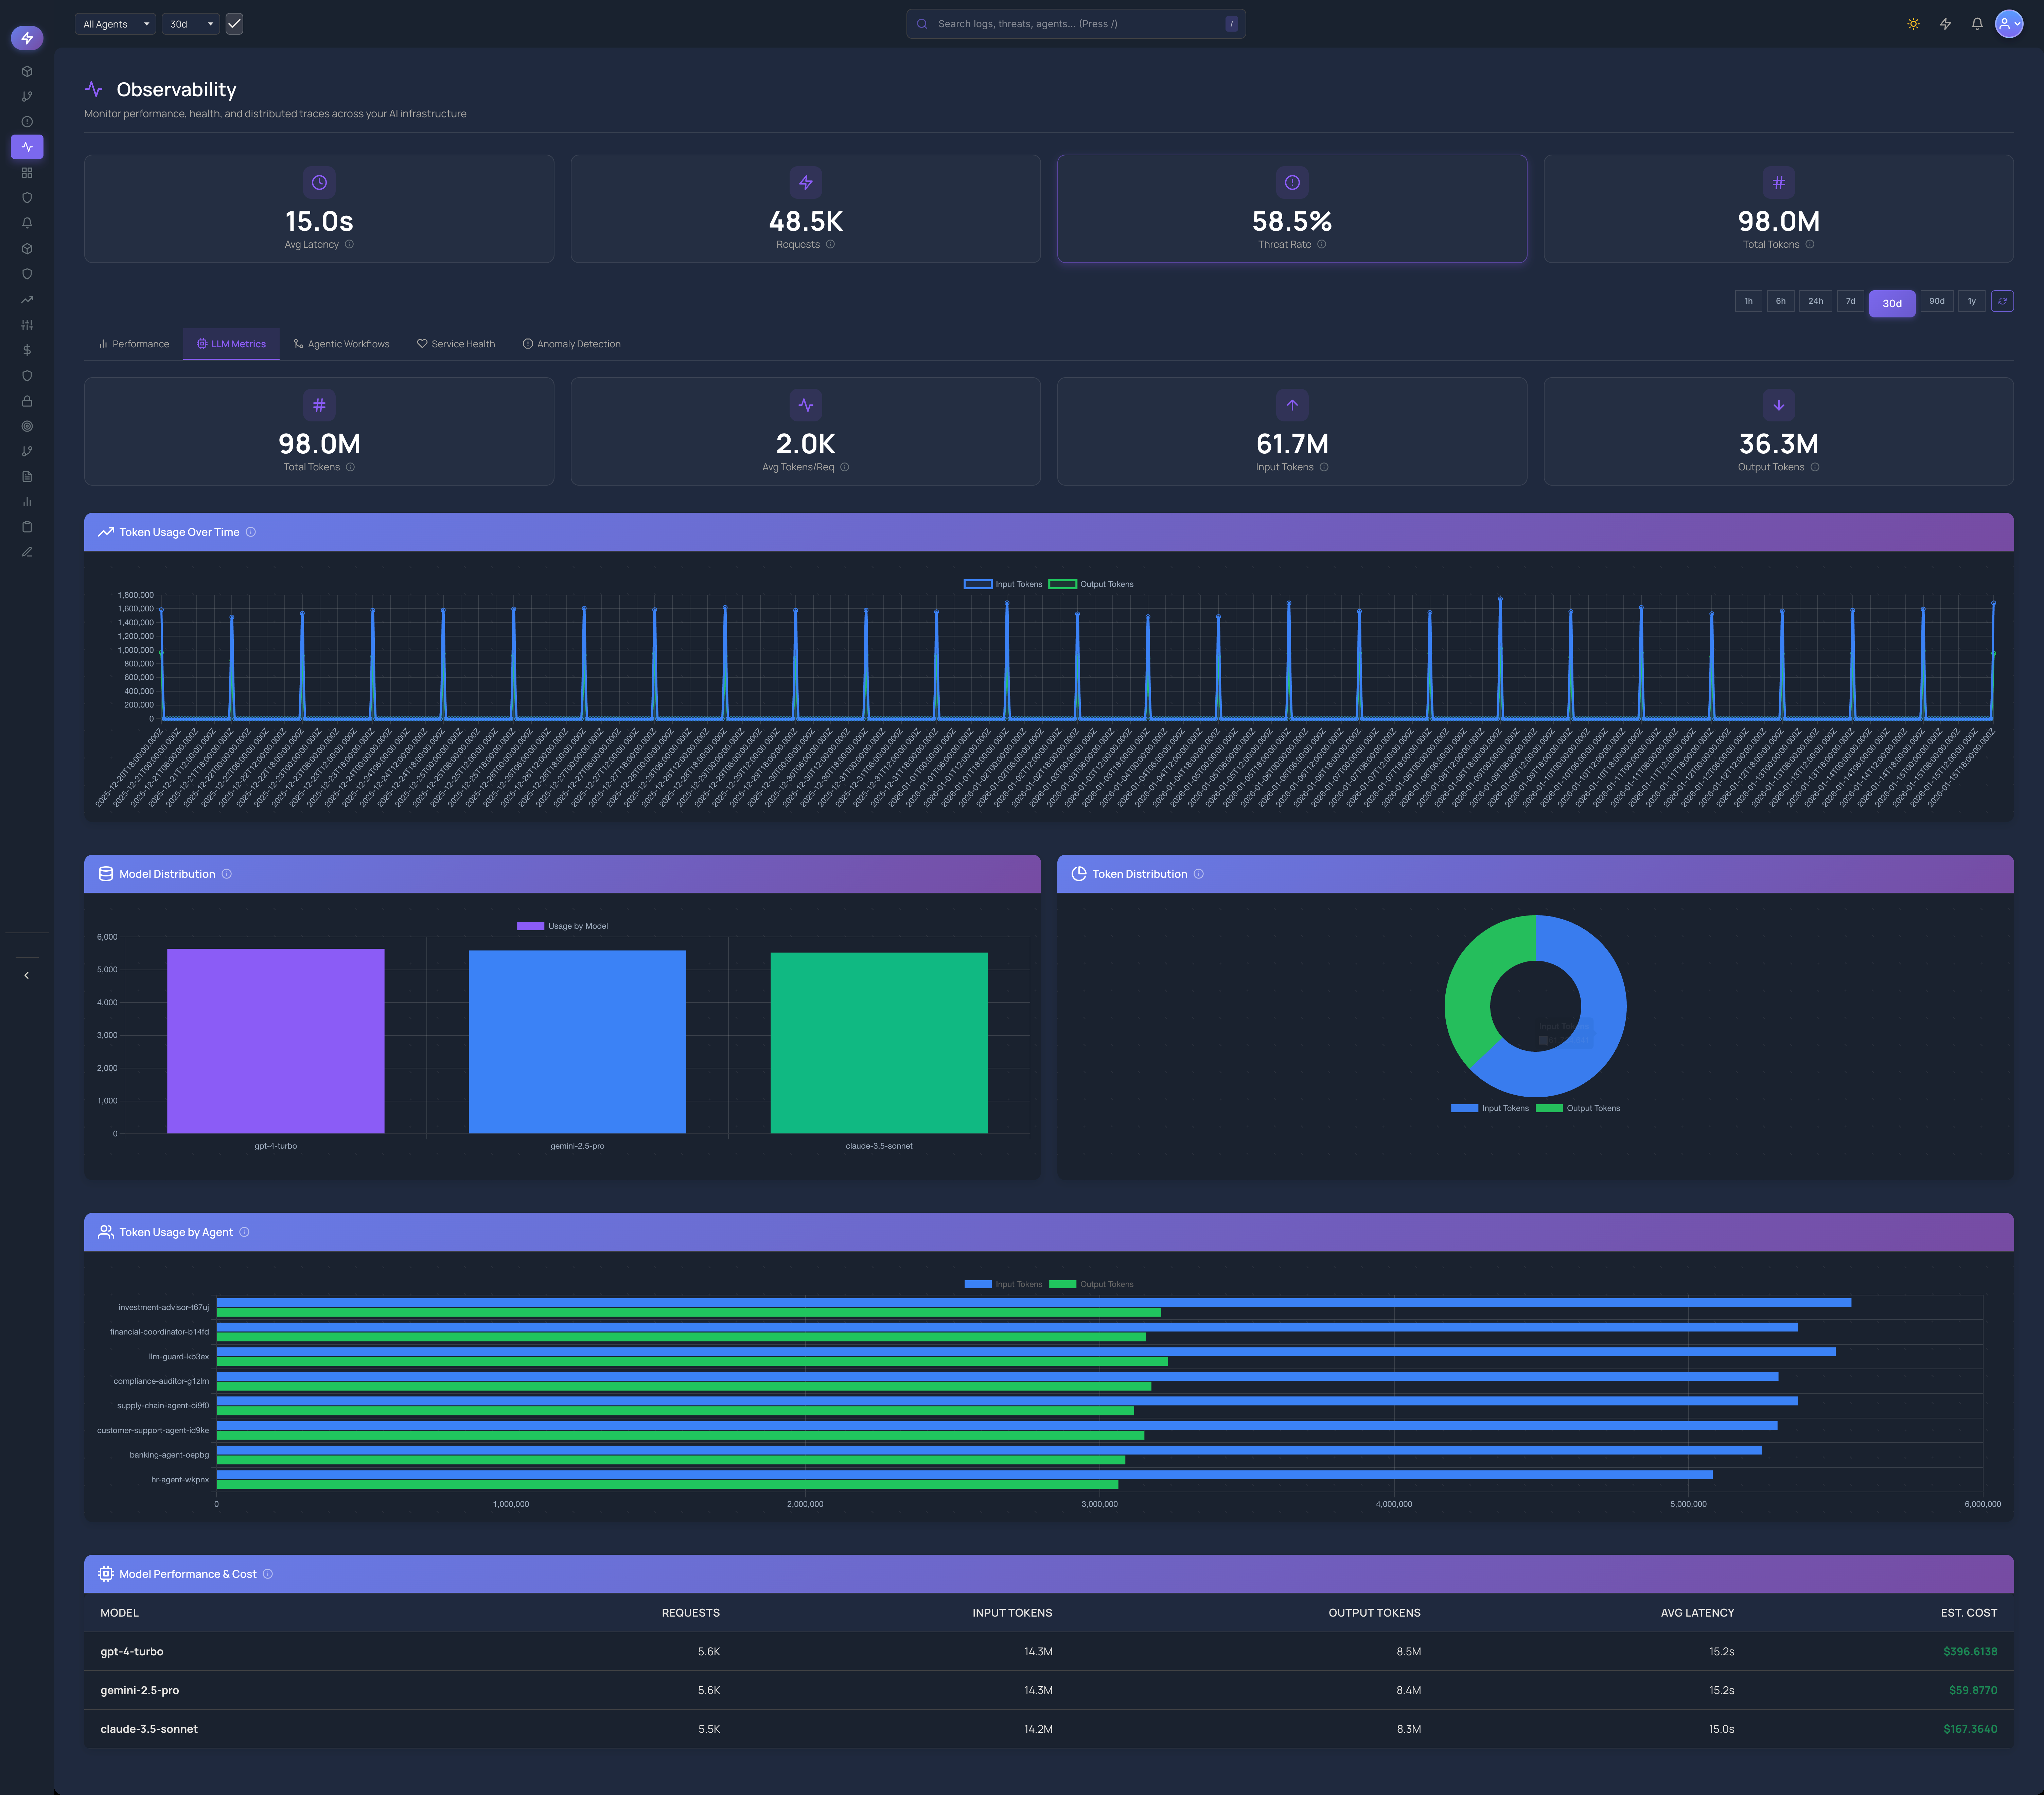
LLM Metrics
Deep insights into model performance, token usage, and cost optimization.
- Token usage breakdown
- Model performance comparison
- Cost per conversation
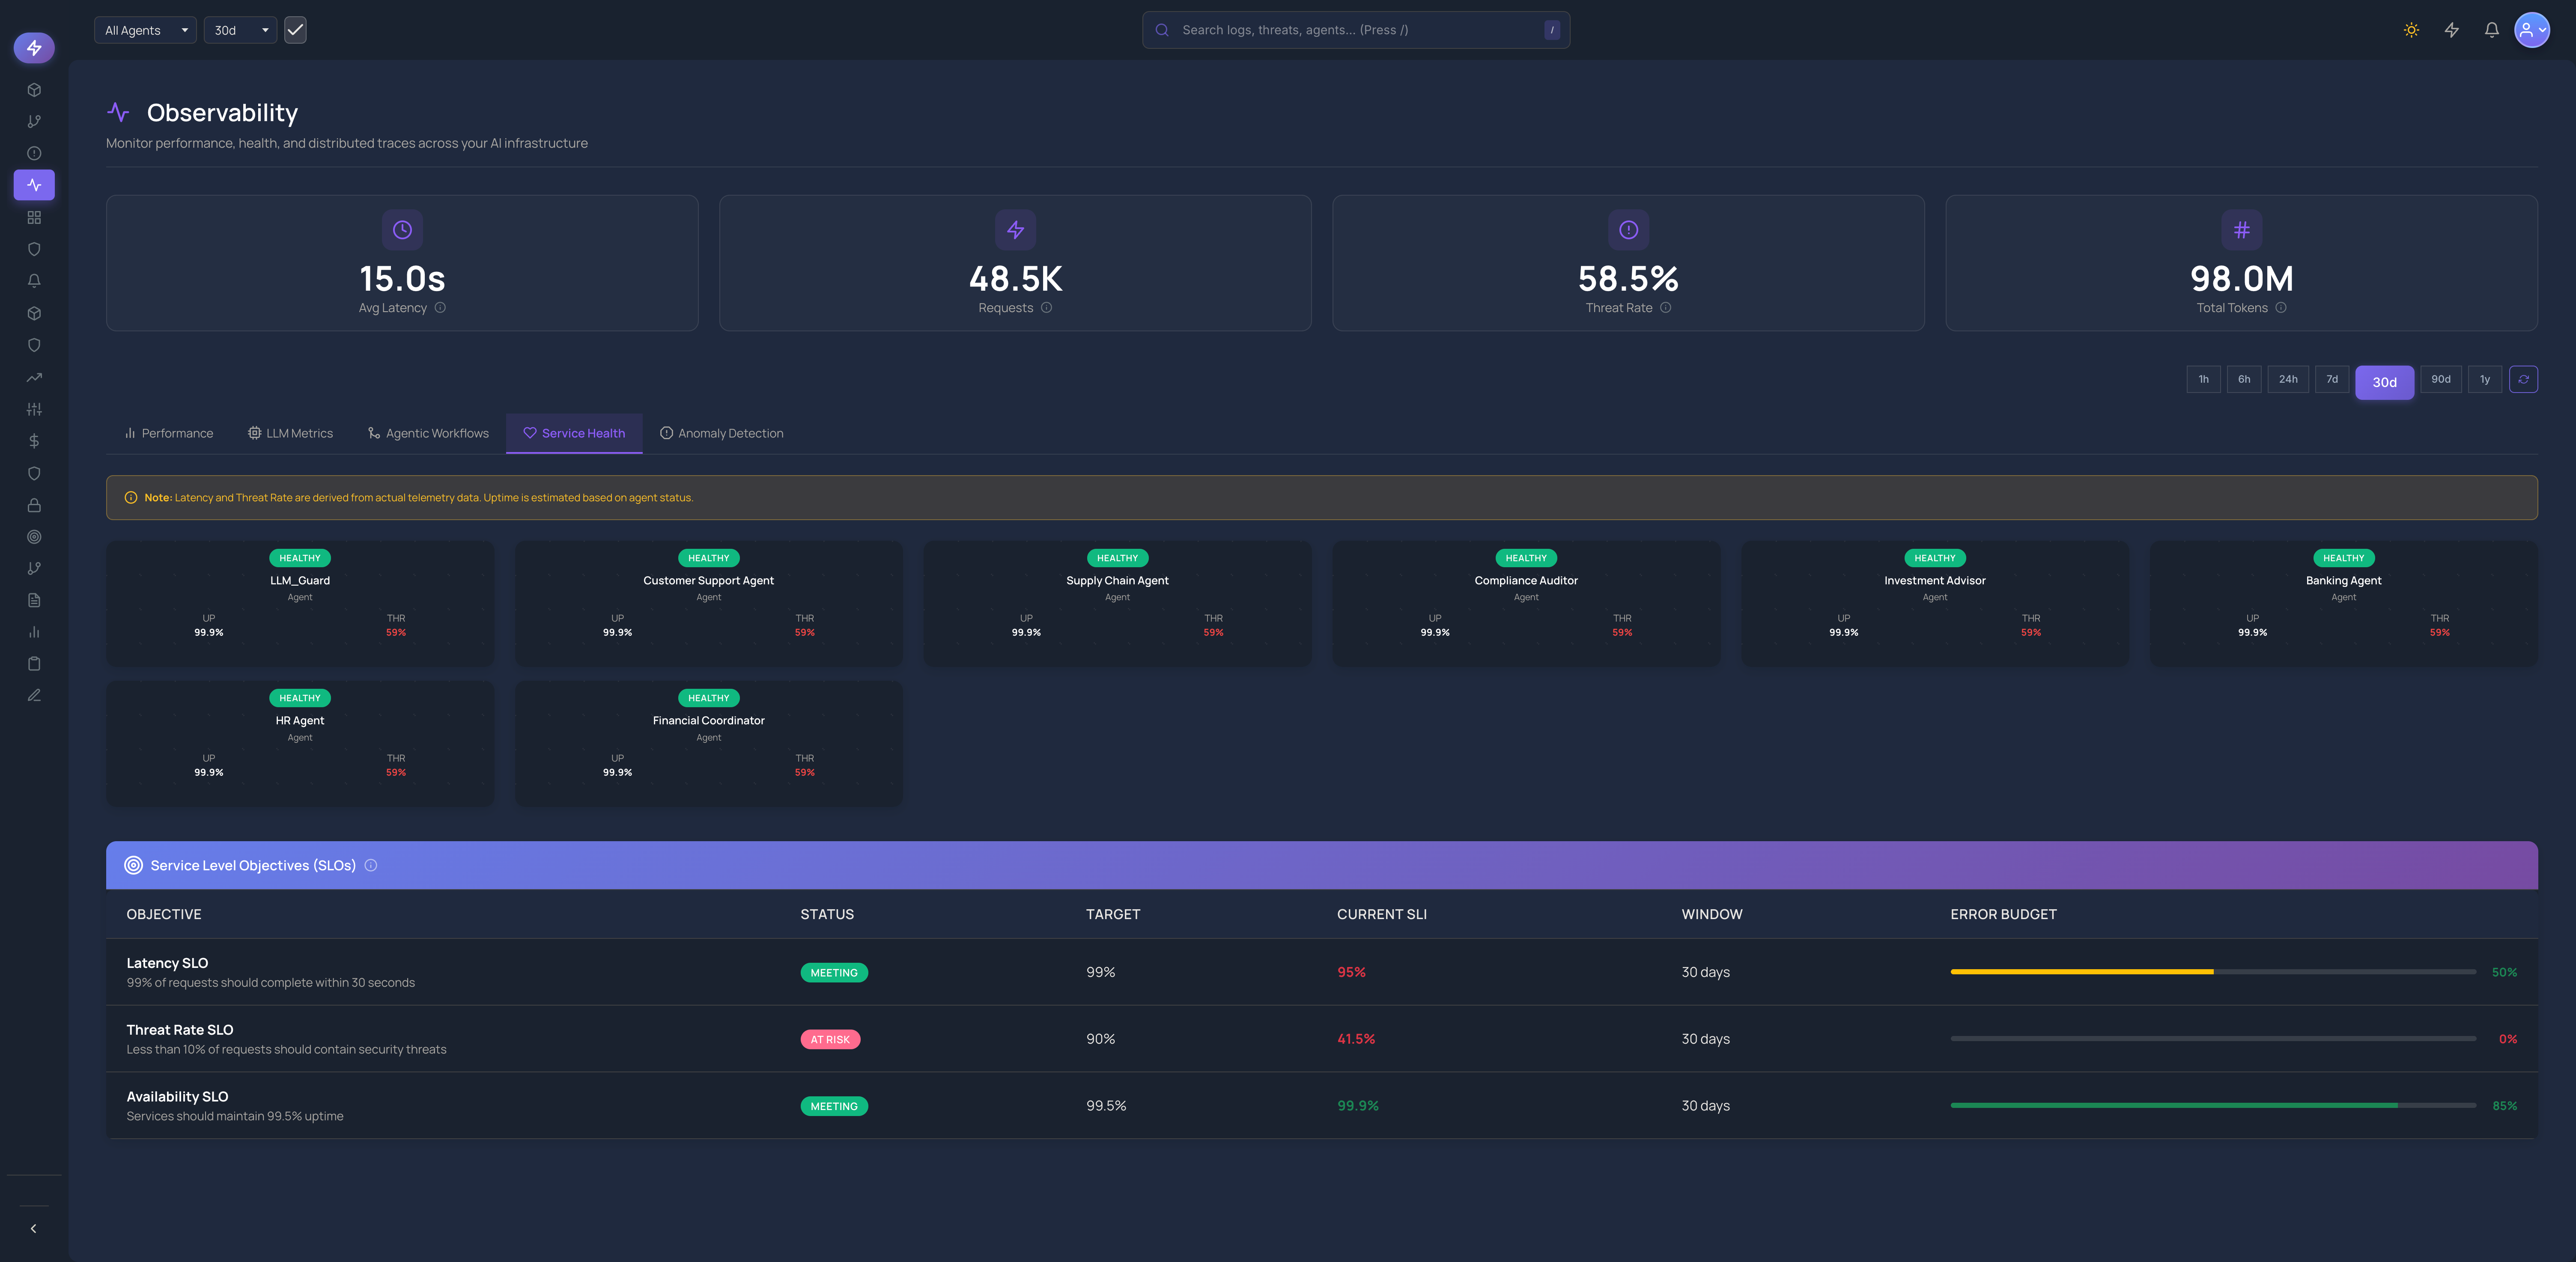
Service Health
Monitor the health and status of all services in your AI infrastructure.
- Service uptime tracking
- Dependency mapping
- Health check alerts
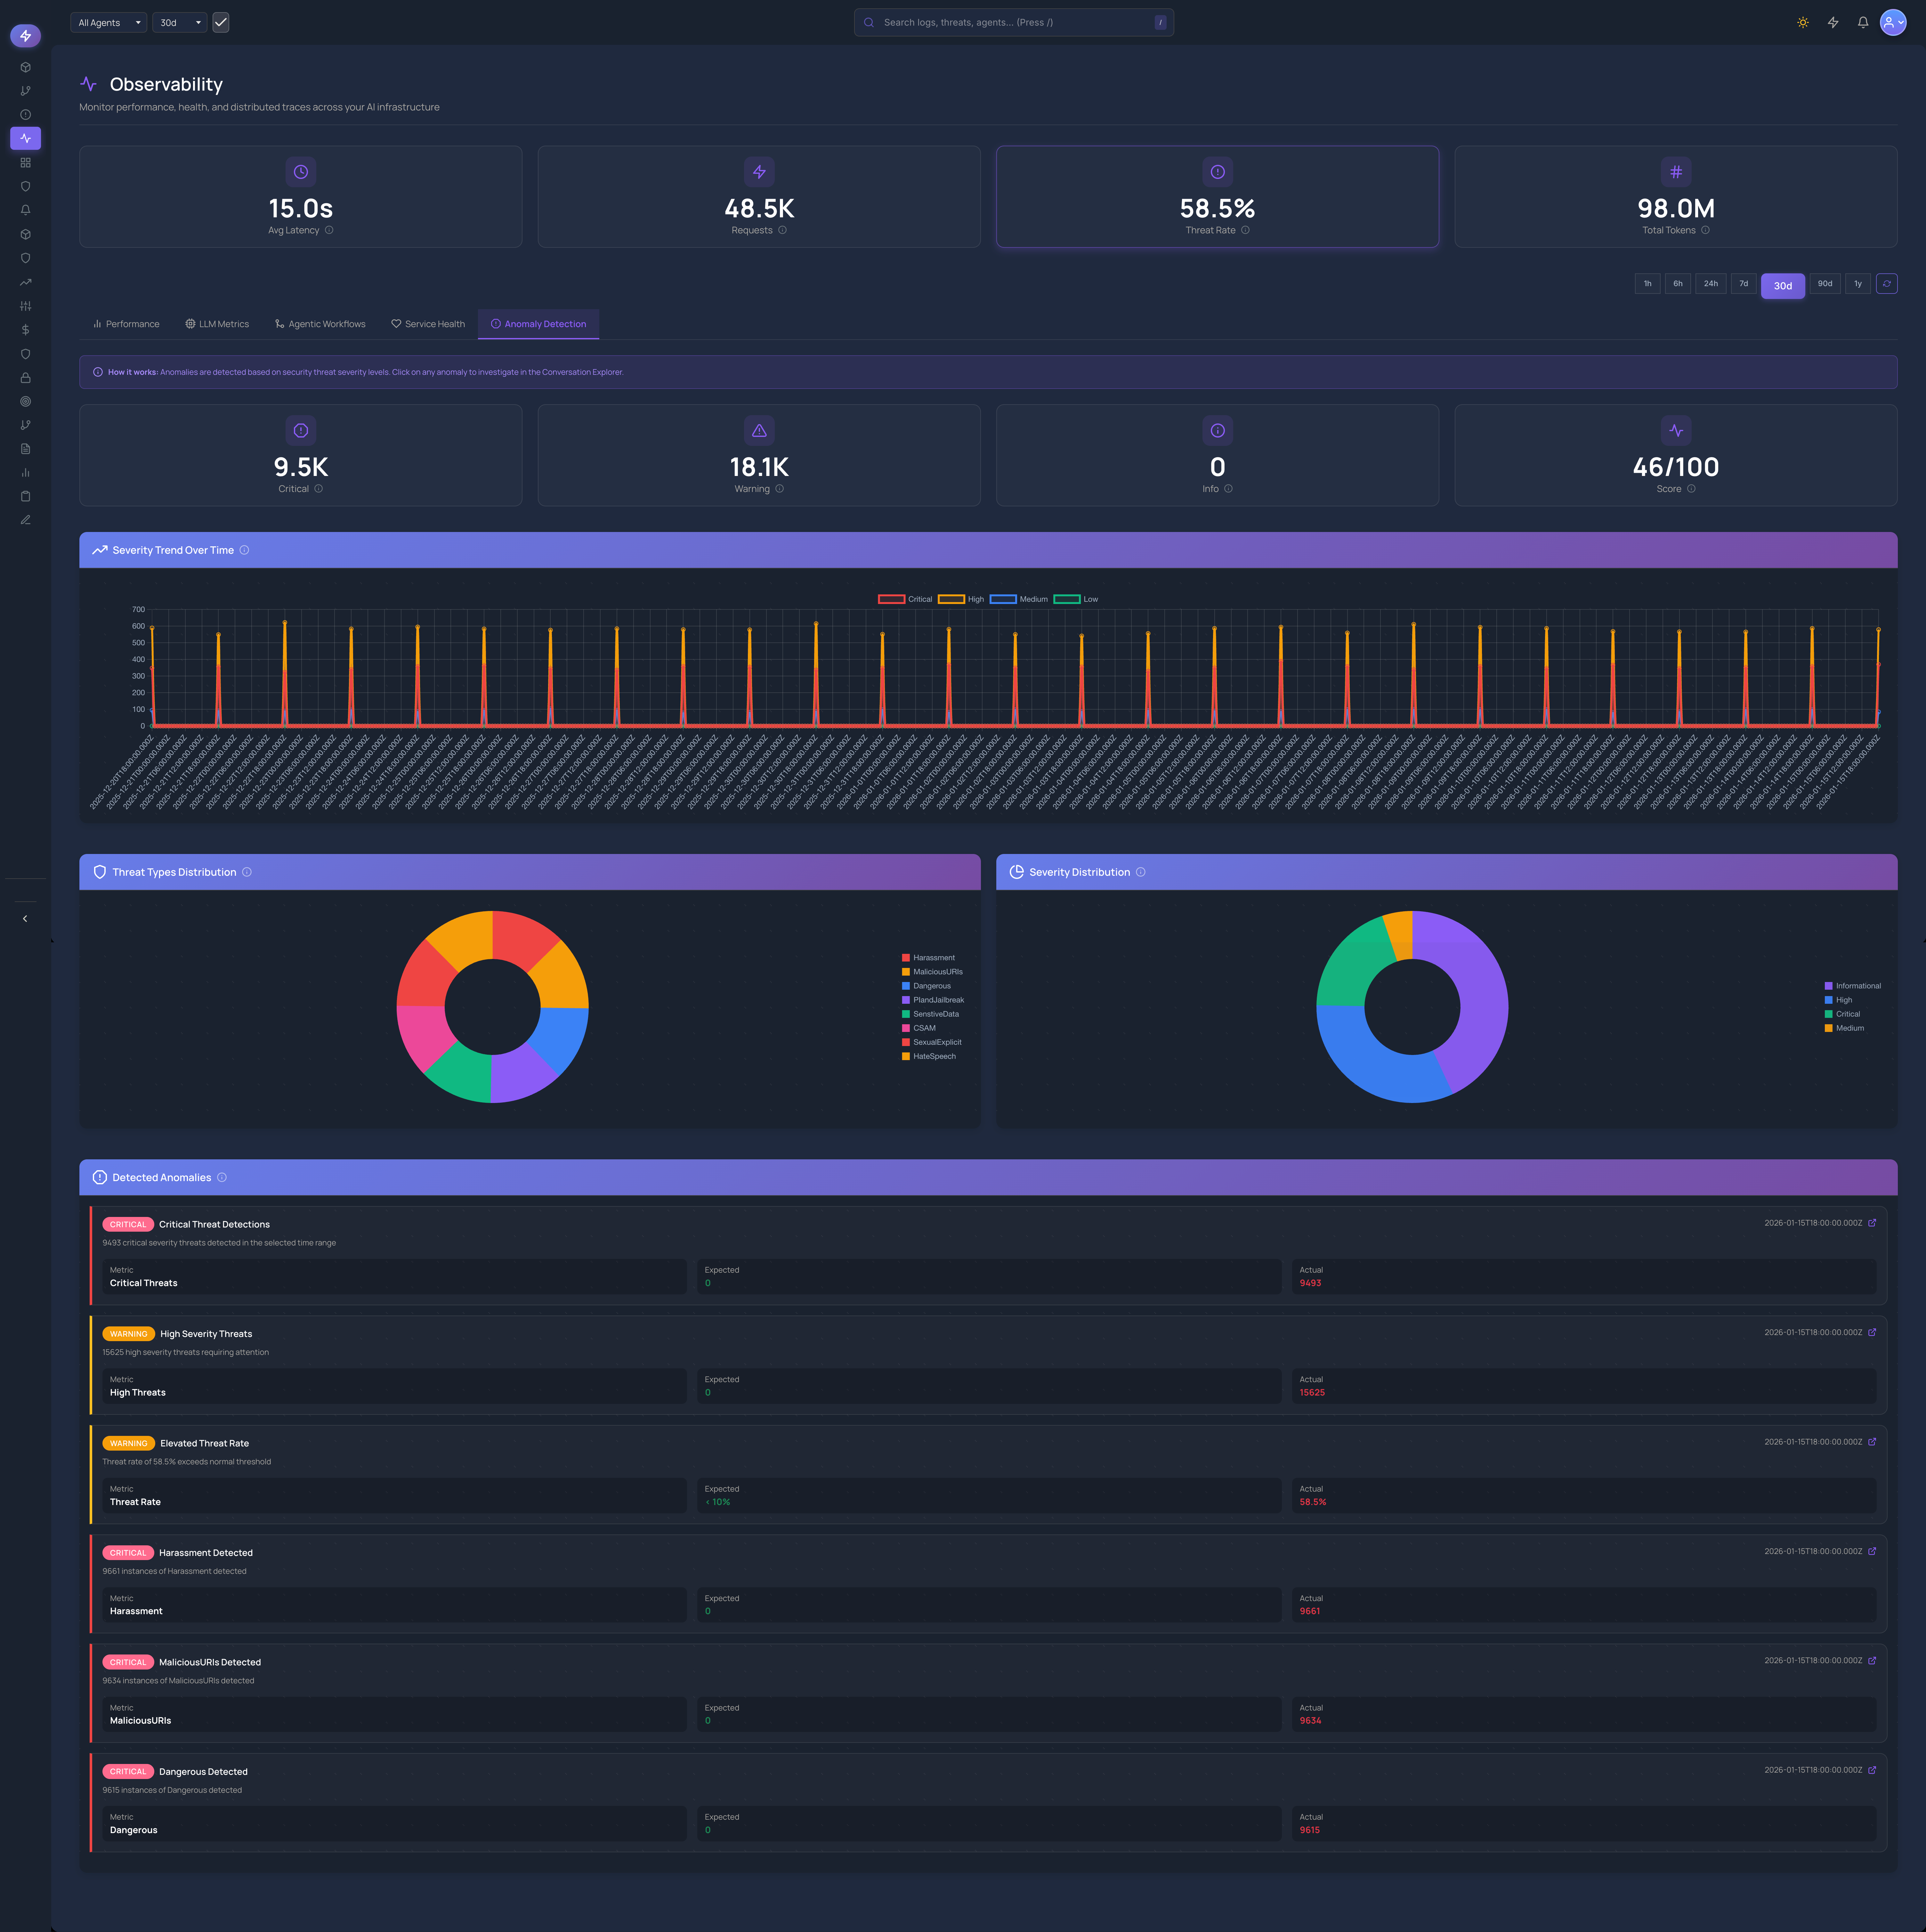
Anomaly Detection
ML-powered detection of unusual patterns and performance degradation.
- Pattern recognition
- Automated alerting
- Root cause analysis
Capabilities
Complete Observability Coverage
Everything you need to understand and optimize your AI agents
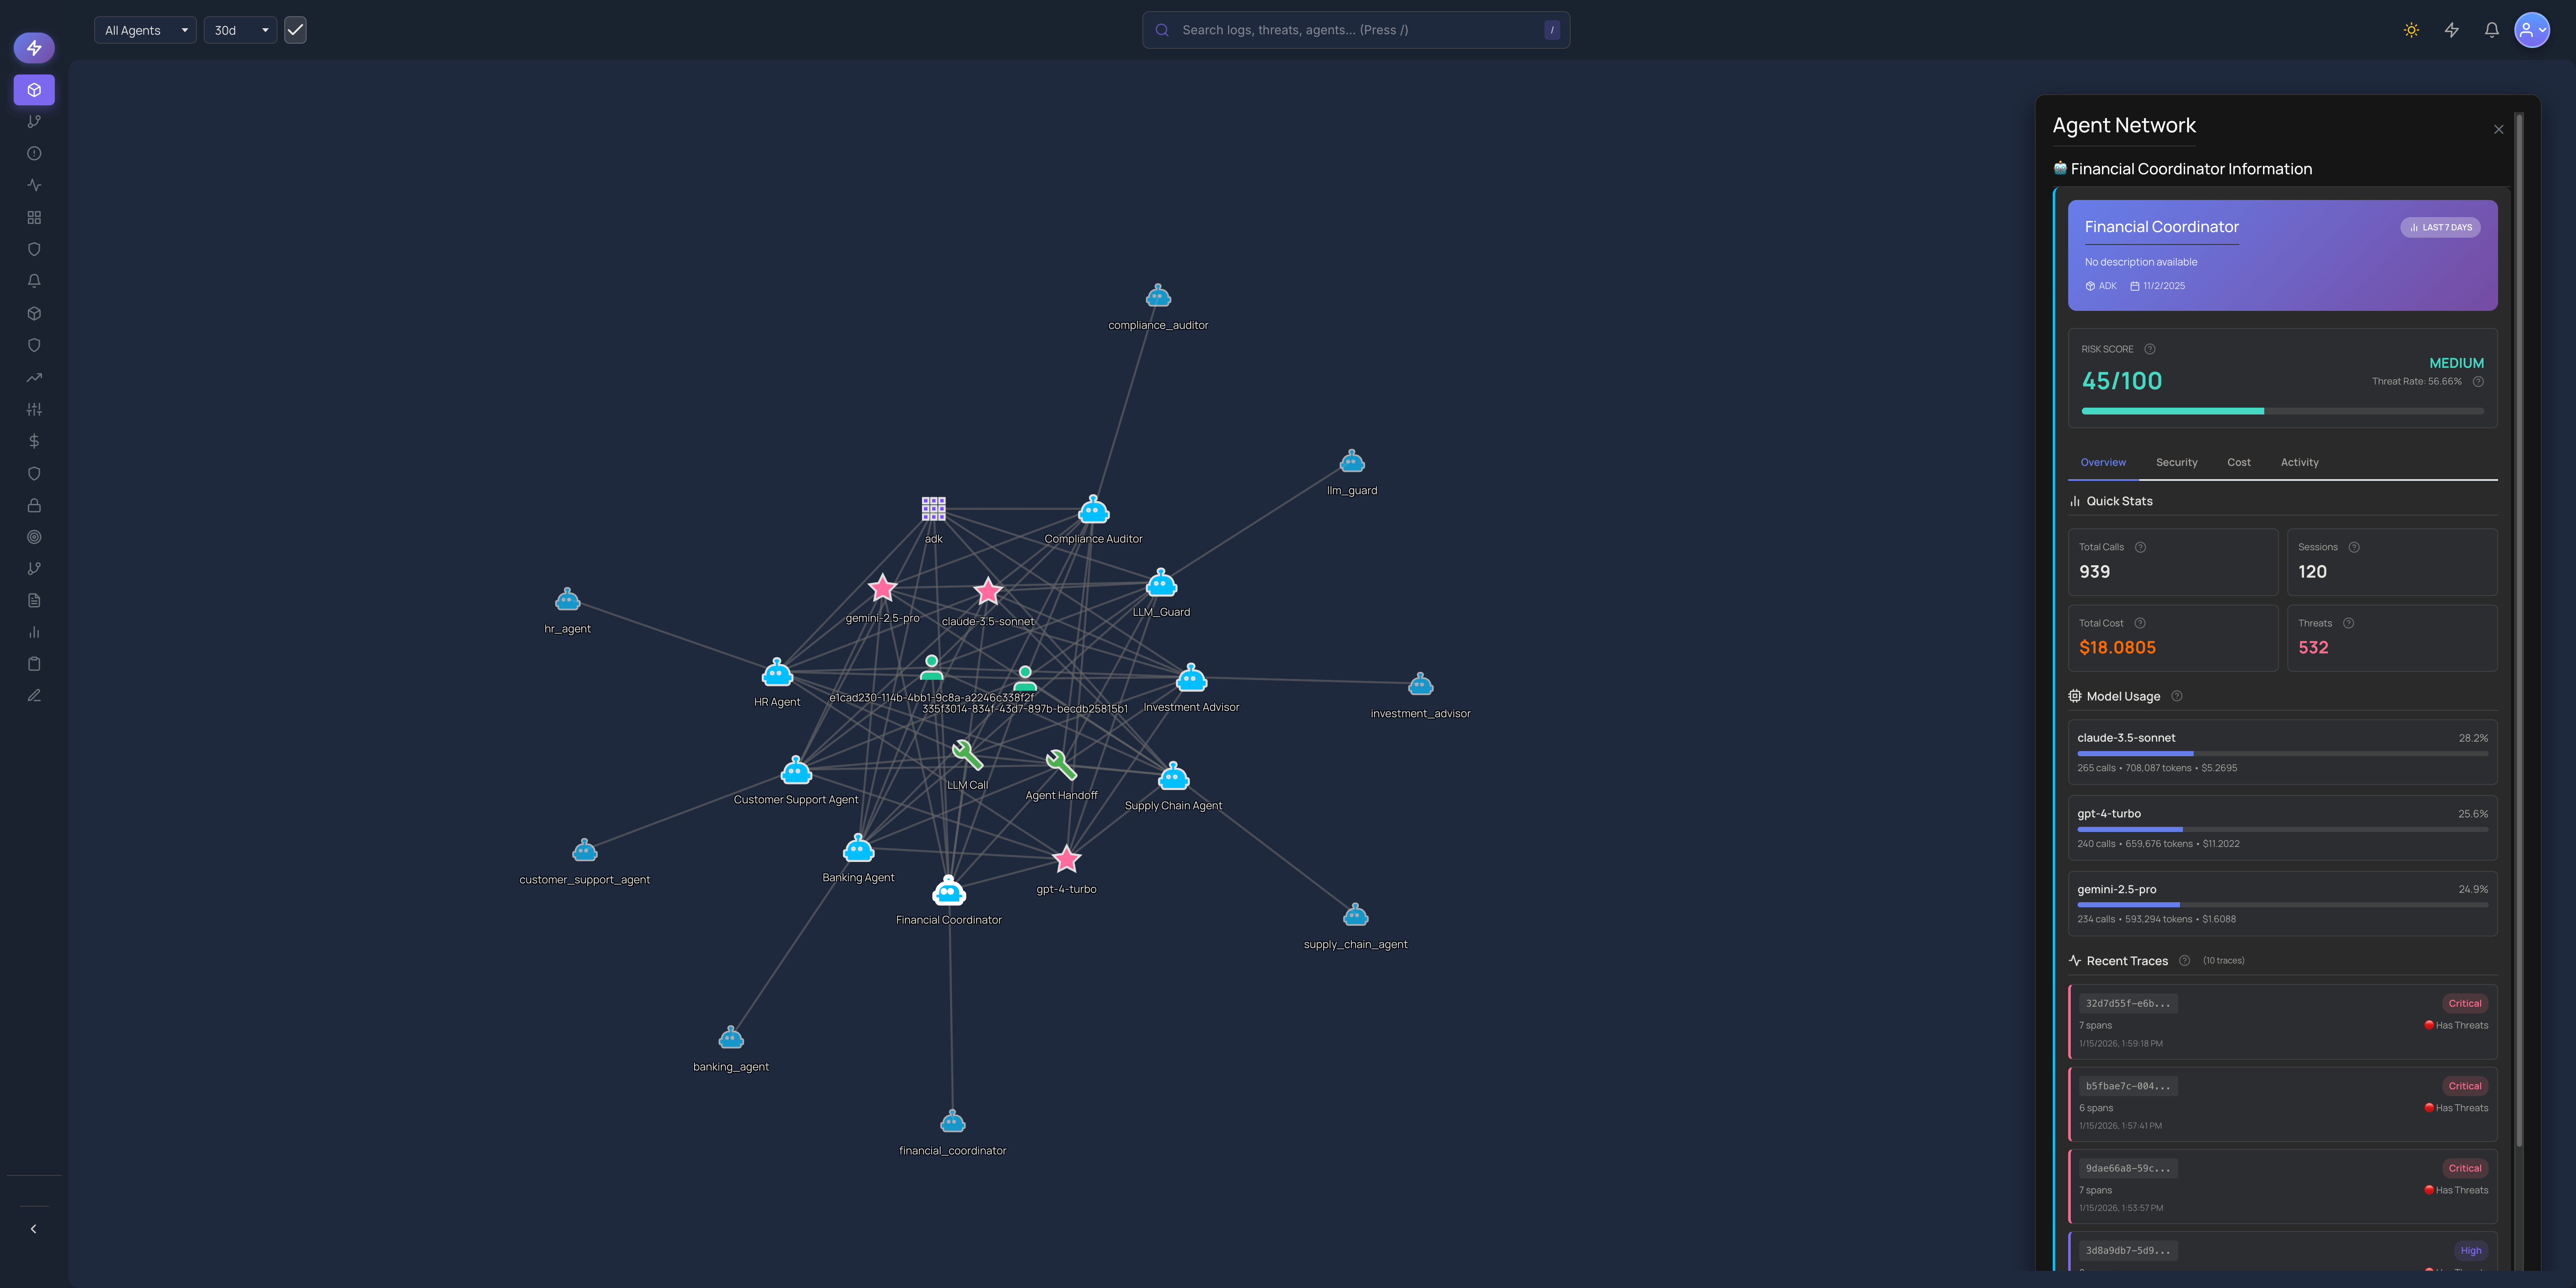
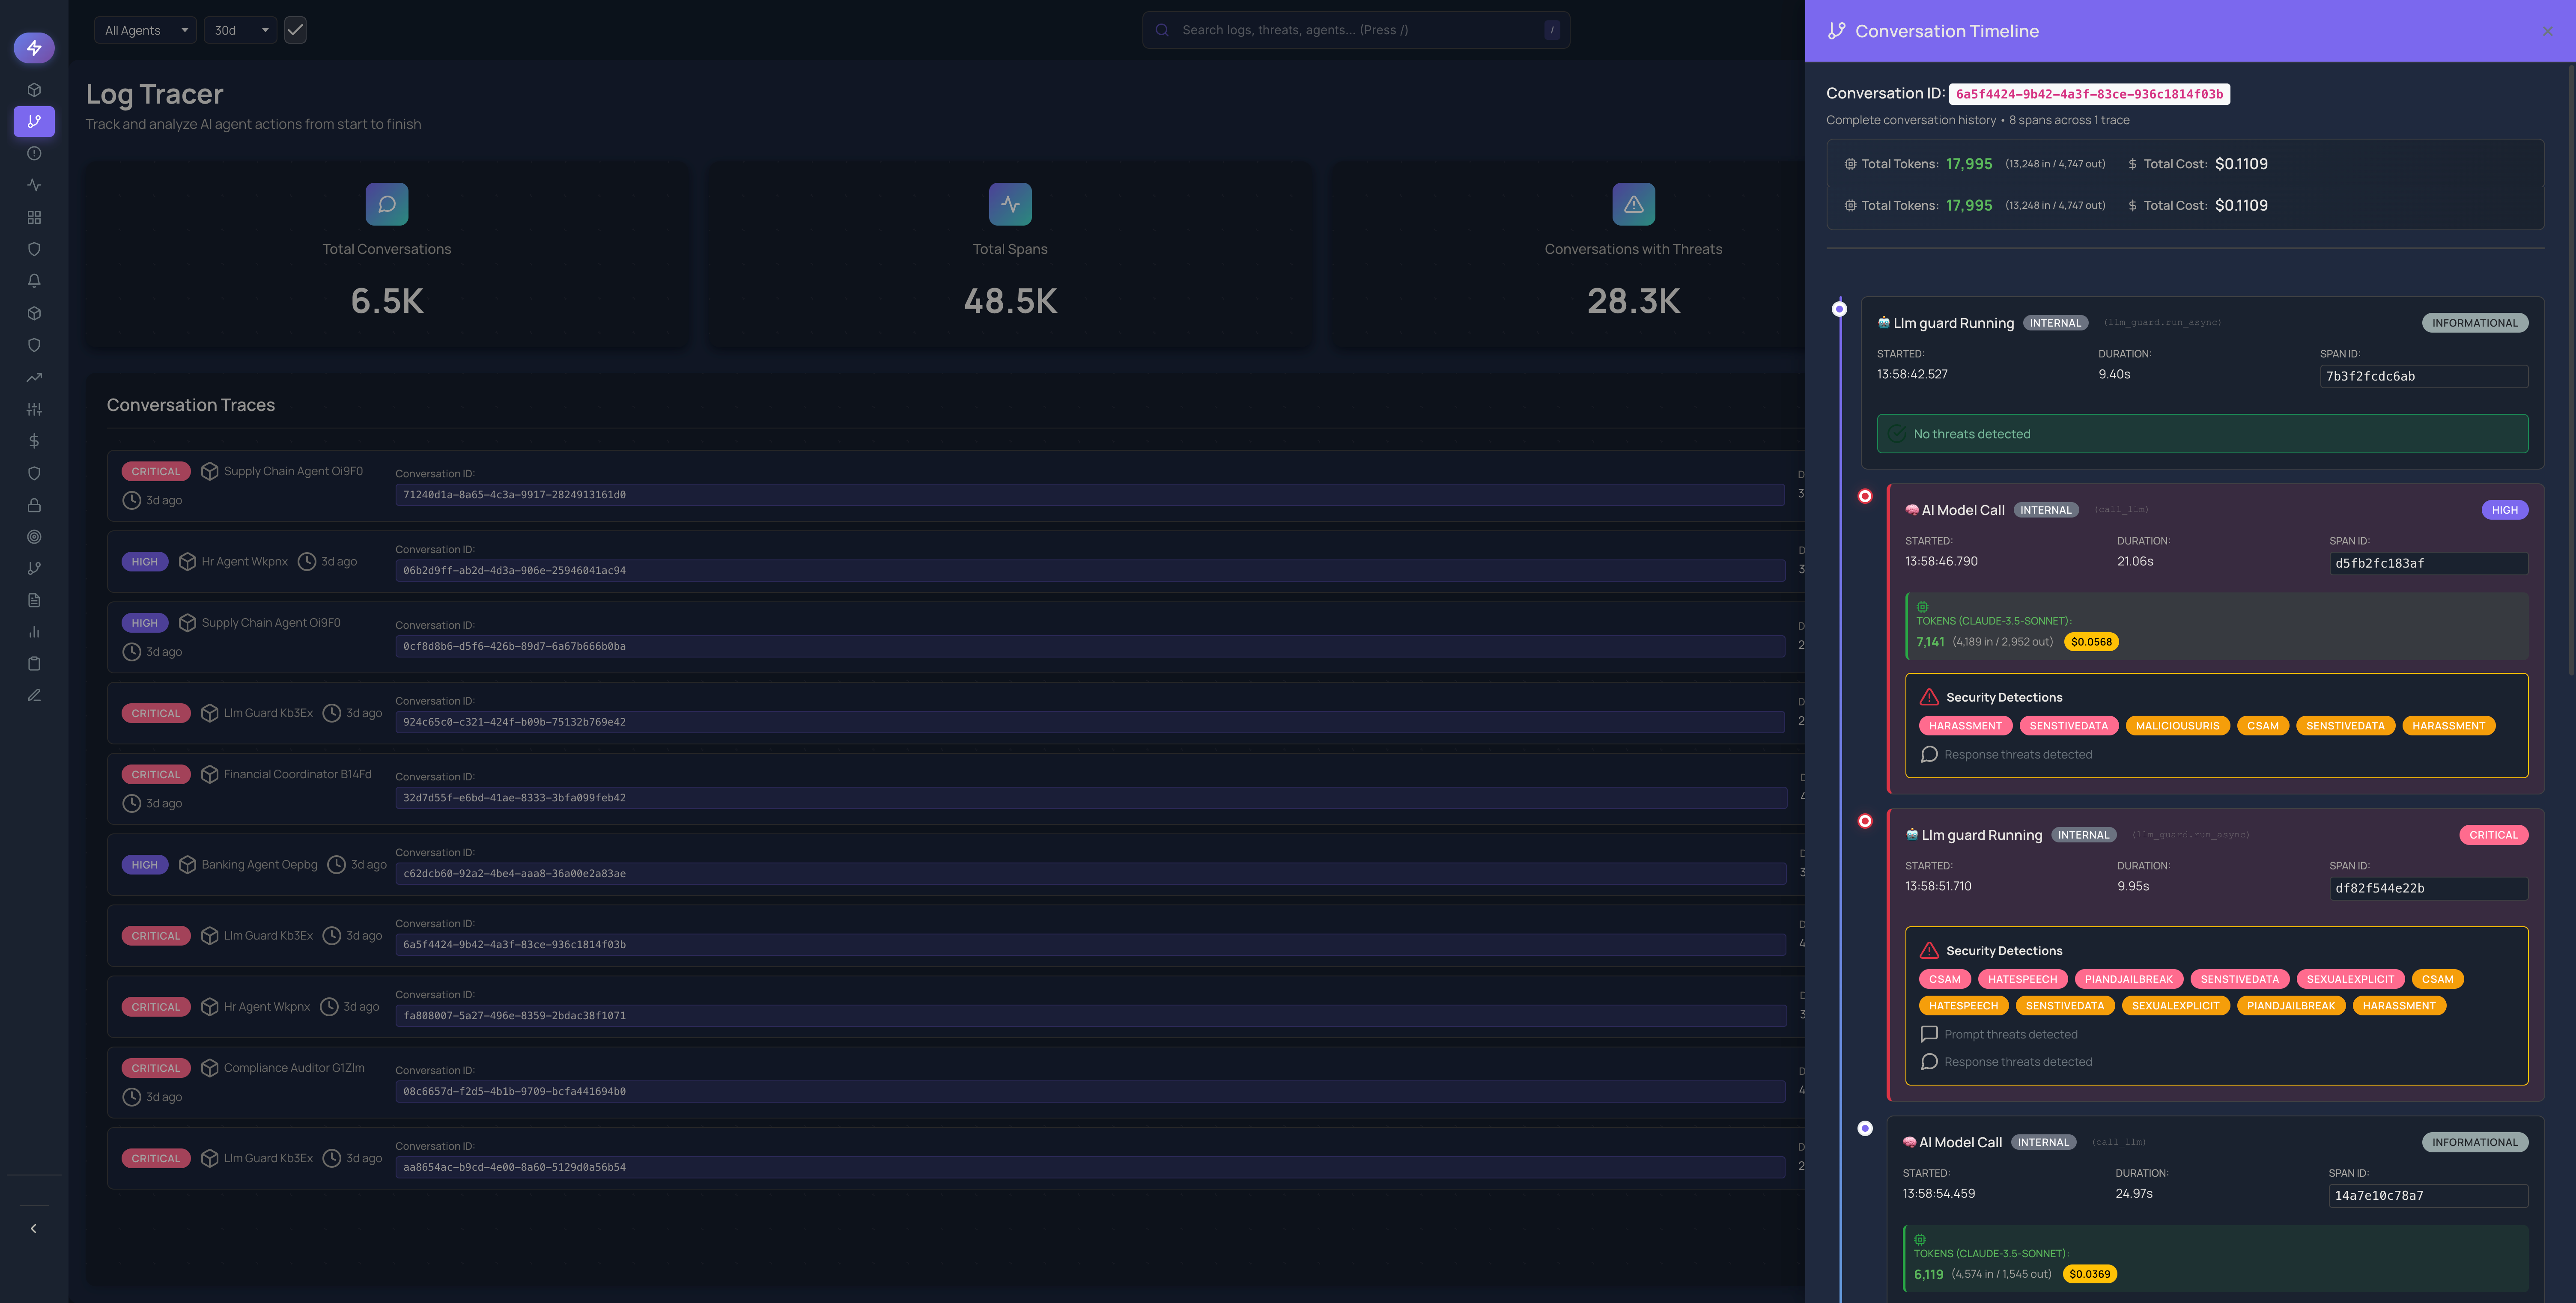
Distributed Tracing
End-to-end visibility into agent workflows with OpenTelemetry-native tracing.
Real-time Dashboards
Live monitoring of agent performance, latency, and throughput metrics.
Conversation Logs
Complete audit trail with searchable logs and conversation replay.
Error Tracking
Automatic detection and alerting on failures and unexpected behaviors.
Performance Analytics
Deep insights into model performance and optimization opportunities.
Alerting & Notifications
Configurable alerts for anomalies, thresholds, and critical events via Slack, email, or webhooks.
How It Works
Visibility at Every Step
Instrument
Drop-in SDK integration with OpenTelemetry support.
Collect
Automatically capture traces, logs, and metrics.
Analyze
Real-time dashboards and intelligent alerting.
Optimize
Identify bottlenecks and improve agent performance.
Ready to see what your AI agents are doing?
Get complete visibility into your AI operations with Saf3AI observability.